

はじめに
ウェブアプリで地図を使おうと思うとまず思いつくのはGoogle Mapだと思います。とても便利なので何も考えずGoogle Mapを使えばいいと思うのですが、商用での利用だったり、多くのユーザーが利用することを前提とする場合コストの面で注意が必要になります。
詳しくはこちらにまとめられているのですが、要するにGoogle MapのAPIを一定量以上利用するとお金がかかります。
どのくらいかかるのかはこちらからシミュレーションすることができますが、ざっくり言うと
・地図の読み込みは 1 か月あたり 28,500 回まで無料
・上記を超えると $14 / 1000リクエスト
なので、例えばGoogle Map APIを利用して毎月10万回地図を表示する場合は約$1000 = 13万円のコストがかかることになります。
商用サービスの場合は売上で回収できることもあると思いますが、上記の例で地図の表示1回のコストは1.3円ということになるので、地図1回表示ごとに1.3円以上の売り上げが見込めないと赤字ということになります。
これは結構きついですね。
OpenStreetMap
そこで登場するのがOpenStreetMapです。
OpenStreetMap は2004年に始まったオープンライセンスの地図なので、OpenStreetMapで事足りるのであれば上記のコストを0にすることができます。
早速使ってみる
ということで早速OpenStreetMapを使ってみようと思います。
OpenStreetMapの利用にはleafletを利用するのが便利らしいので、leafletを利用して進めたいと思います。
1番シンプルな例
まずはleafletに掲載されていた1番シンプルな例を試してみたいと思います。leafletの例はイギリスだったので日本に変えつつ、余計なコードは全て削っています。
<!DOCTYPE html>
<html>
  <head>
    <meta charset="utf-8">
    <meta name="viewport" content="width=device-width, initial-scale=1">
    <link rel="stylesheet" href="https://unpkg.com/leaflet@1.9.3/dist/leaflet.css" integrity="sha256-kLaT2GOSpHechhsozzB+flnD+zUyjE2LlfWPgU04xyI=" crossorigin=""/>
    <script src="https://unpkg.com/leaflet@1.9.3/dist/leaflet.js" integrity="sha256-WBkoXOwTeyKclOHuWtc+i2uENFpDZ9YPdf5Hf+D7ewM=" crossorigin=""></script>
    <style>
     html, body {
       height: 100%;
       margin: 0;
     }
     .leaflet-container {
       height: 400px;
       width: 100%;
     }
     #map{
       width:100%;
       height:400px;
     }
    </style>
  </head>
  <body>
    <div id="map"></div>
    <script>
     const map = L.map('map').setView([36,139], 5);
     const tiles = L.tileLayer('https://tile.openstreetmap.org/{z}/{x}/{y}.png', {
       maxZoom: 19,
       attribution: '© <a href="http://www.openstreetmap.org/copyright">OpenStreetMap</a>'
     }).addTo(map);

    </script>
  </body>
</html>
上記コードで下のようなページが表示できます。
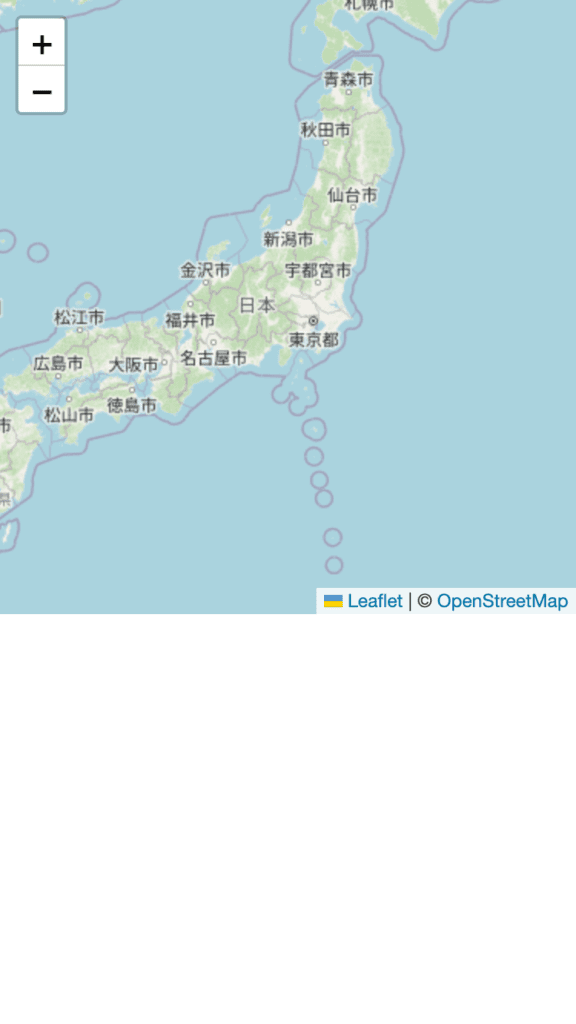
setViewの36が緯度、139が経度です。
5は倍率なのでここを変えると表示倍率が変わります。
const map = L.map('map').setView([36,139], 5);一旦これで最低限地図を表示することができました。
マーカーを配置する
マーカーを配置するのはとても簡単で下記のように実装できます。
<!DOCTYPE html>
<html>
  <head>
    <meta charset="utf-8">
    <meta name="viewport" content="width=device-width, initial-scale=1">
    <link rel="stylesheet" href="https://unpkg.com/leaflet@1.9.3/dist/leaflet.css" integrity="sha256-kLaT2GOSpHechhsozzB+flnD+zUyjE2LlfWPgU04xyI=" crossorigin=""/>
    <script src="https://unpkg.com/leaflet@1.9.3/dist/leaflet.js" integrity="sha256-WBkoXOwTeyKclOHuWtc+i2uENFpDZ9YPdf5Hf+D7ewM=" crossorigin=""></script>
    <style>
     html, body {
       height: 100%;
       margin: 0;
     }
     .leaflet-container {
       height: 400px;
       width: 100%;
     }
     #map{
       width:100%;
       height:400px;
     }
    </style>
  </head>
  <body>
    <div id="map"></div>
    <script>
     const map = L.map('map').setView([36,139], 5);
     const tiles = L.tileLayer('https://tile.openstreetmap.org/{z}/{x}/{y}.png', {
       maxZoom: 19,
       attribution: '© <a href="http://www.openstreetmap.org/copyright">OpenStreetMap</a>'
     }).addTo(map);
     var marker = L.marker([36,139]).addTo(map);//ここを追加したのみ
    </script>
  </body>
</html>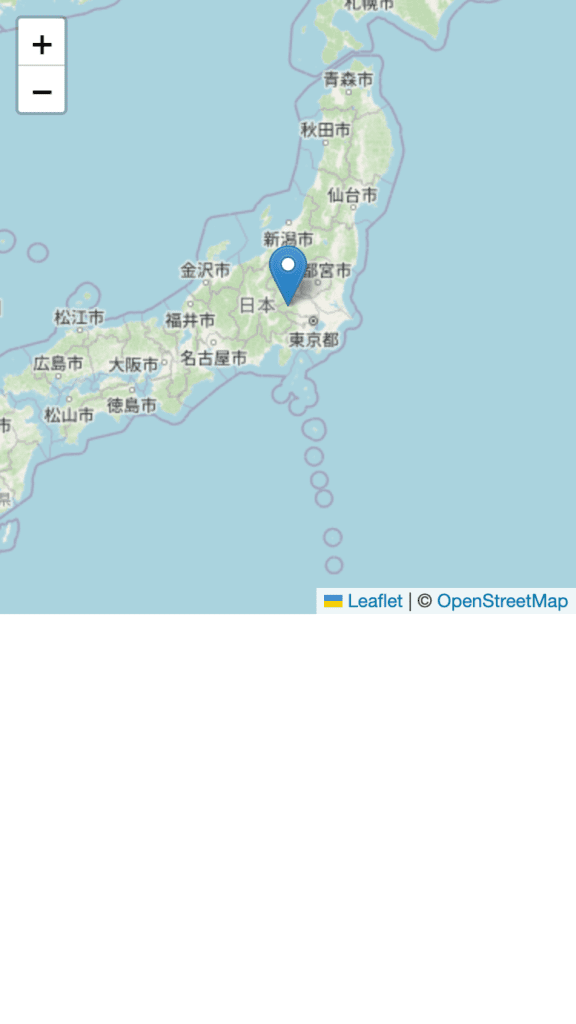
追加したのは1行だけです。
var marker = L.marker([36,139]).addTo(map);//ここを追加したのみマーカーをカスタマイズ
マーカーに独自のカスタマイズを加えるには
<!DOCTYPE html>
<html>
  <head>
    <meta charset="utf-8">
    <meta name="viewport" content="width=device-width, initial-scale=1">
    <link rel="stylesheet" href="https://unpkg.com/leaflet@1.9.3/dist/leaflet.css" integrity="sha256-kLaT2GOSpHechhsozzB+flnD+zUyjE2LlfWPgU04xyI=" crossorigin=""/>
    <script src="https://unpkg.com/leaflet@1.9.3/dist/leaflet.js" integrity="sha256-WBkoXOwTeyKclOHuWtc+i2uENFpDZ9YPdf5Hf+D7ewM=" crossorigin=""></script>
    <style>
     html, body {
       height: 100%;
       margin: 0;
     }
     .leaflet-container {
       height: 400px;
       width: 100%;
     }
     #map{
       width:100%;
       height:400px;
     }
    </style>
  </head>
  <body>
    <div id="map"></div>
    <script>
     const map = L.map('map').setView([36,139], 5);
     const tiles = L.tileLayer('https://tile.openstreetmap.org/{z}/{x}/{y}.png', {
       maxZoom: 19,
       attribution: '© <a href="http://www.openstreetmap.org/copyright">OpenStreetMap</a>'
     }).addTo(map);
     //ここから
     var greenIcon = L.icon({
       iconUrl: 'https://leafletjs.com/examples/custom-icons/leaf-green.png',
       shadowUrl: 'https://leafletjs.com/examples/custom-icons/leaf-shadow.png',
       iconSize:     [38, 95], // size of the icon
       shadowSize:   [50, 64], // size of the shadow
       iconAnchor:   [22, 94], // point of the icon which will correspond to marker's location
       shadowAnchor: [4, 62],  // the same for the shadow
       popupAnchor:  [-3, -76] // point from which the popup should open relative to the iconAnchor
     });
     var marker = L.marker([36,139], {icon: greenIcon}).addTo(map);
     //ここまで
    </script>
  </body>
</html>
上記のように変更すると、
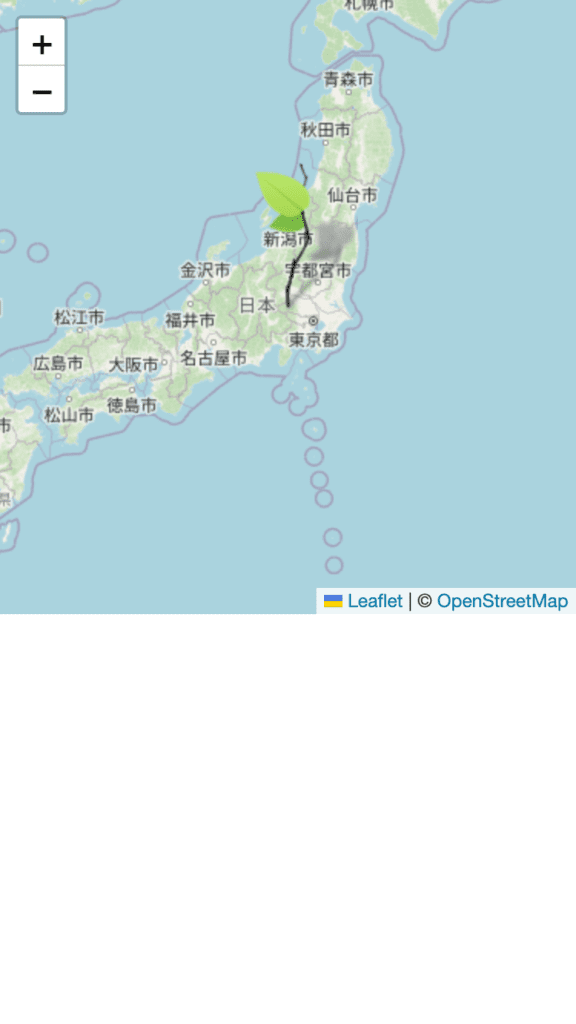
こんな感じで独自のマーカーを置くことができます。
変更点は下記です。
 //ここから
 var greenIcon = L.icon({
   iconUrl: 'https://leafletjs.com/examples/custom-icons/leaf-green.png',
   shadowUrl: 'https://leafletjs.com/examples/custom-icons/leaf-shadow.png',
   iconSize:     [38, 95], // size of the icon
   shadowSize:   [50, 64], // size of the shadow
   iconAnchor:   [22, 94], // point of the icon which will correspond to marker's location
   shadowAnchor: [4, 62],  // the same for the shadow
   popupAnchor:  [-3, -76] // point from which the popup should open relative to the iconAnchor
 });
 var marker = L.marker([36,139], {icon: greenIcon}).addTo(map);
 //ここまで
そのほかのマーカー関連
下記にマーカー関連のドキュメントがまとまっています。
